Impact of Adblockers on Google Analytics (vs. Plausible)
Adblocker usage is quickly rising, with some estimates saying that almost 25% of internet users have one installed. Not only do they block advertisements, but also analytics scripts (like Google Analytics, Matomo, etc.)
So that begs the question: what is the impact of these blockers on Google Analytics? A significant impact could mean that your analytics are underreporting the number of visitors you get. Let's investigate!
Stats
Various sources report that about 10-25% of internet users have an ad blocker installed (Google, eMarketer, Business Insider).
If we look at sheer numbers, we can see that blockers like uBlock Origin, Adblock, Adblock Plus all have 10+ million active users on Chrome (unfortunately, the number doesn't go higher). The last two even claim to have 65 and 100+ million users. Wow!
Test setup
So, to test the impact that ad blockers have on web analytics, I added Plausible Analytics to this website, in addition to Google Analytics.
I chose Plausible because I assumed that "privacy-friendly" analytics would not be blocked by default. But I was wrong.
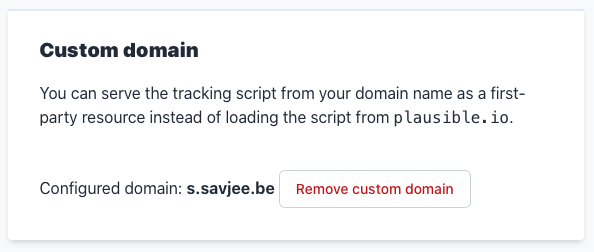
To circumvent these blocklists, I hosted Plausible's script on my own domain (s.savjee.be). Since my domain is not listed, everything passes just fine.

I ran this experiment for 29 days and then compared the metrics from Plausible with the ones from Google Analytics.
Featured on Hacker News
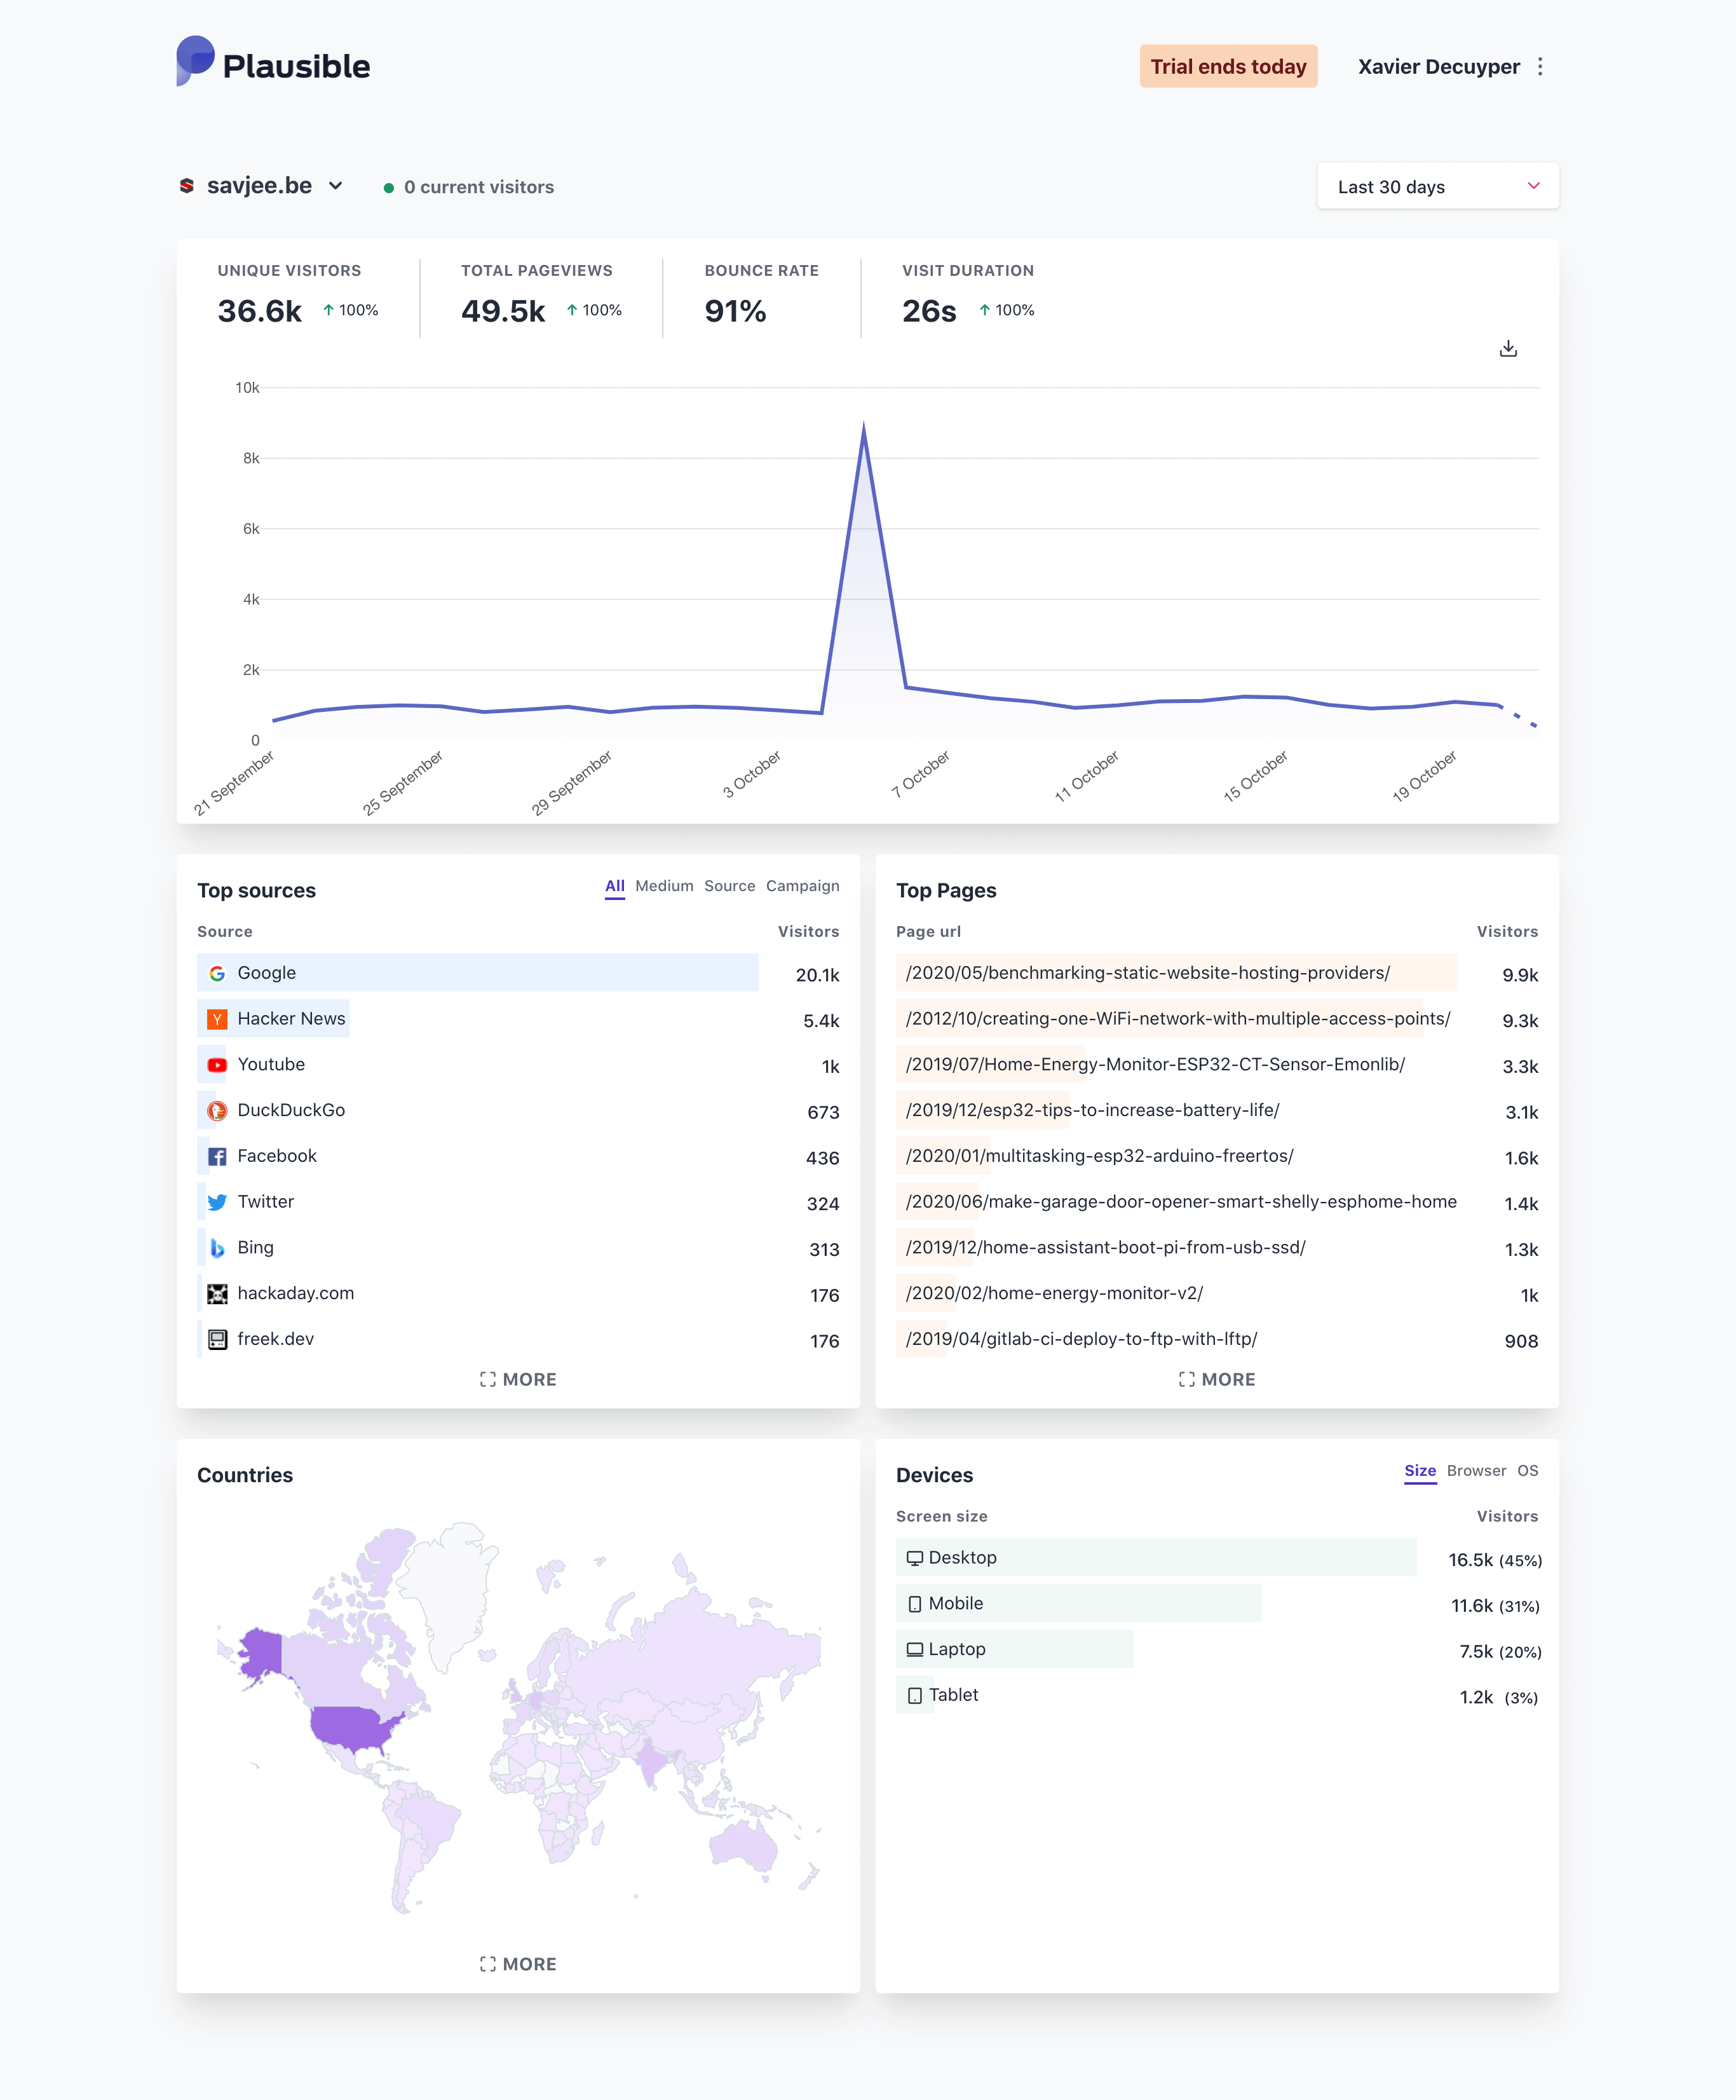
While running this experiment, one of my blog posts was featured on Hacker News and got up to 12th place:

Hacker News is visited by more technical people, that are more likely to have ad blockers installed (technical know-how). This provided a great opportunity to see if a traffic spike from Hacker News would also increase the difference between Google Analytics and Plausible.
Findings
After 29 days, I logged into both Plausible and Google Analytics and exported all my data to CSV files.

Visitor count
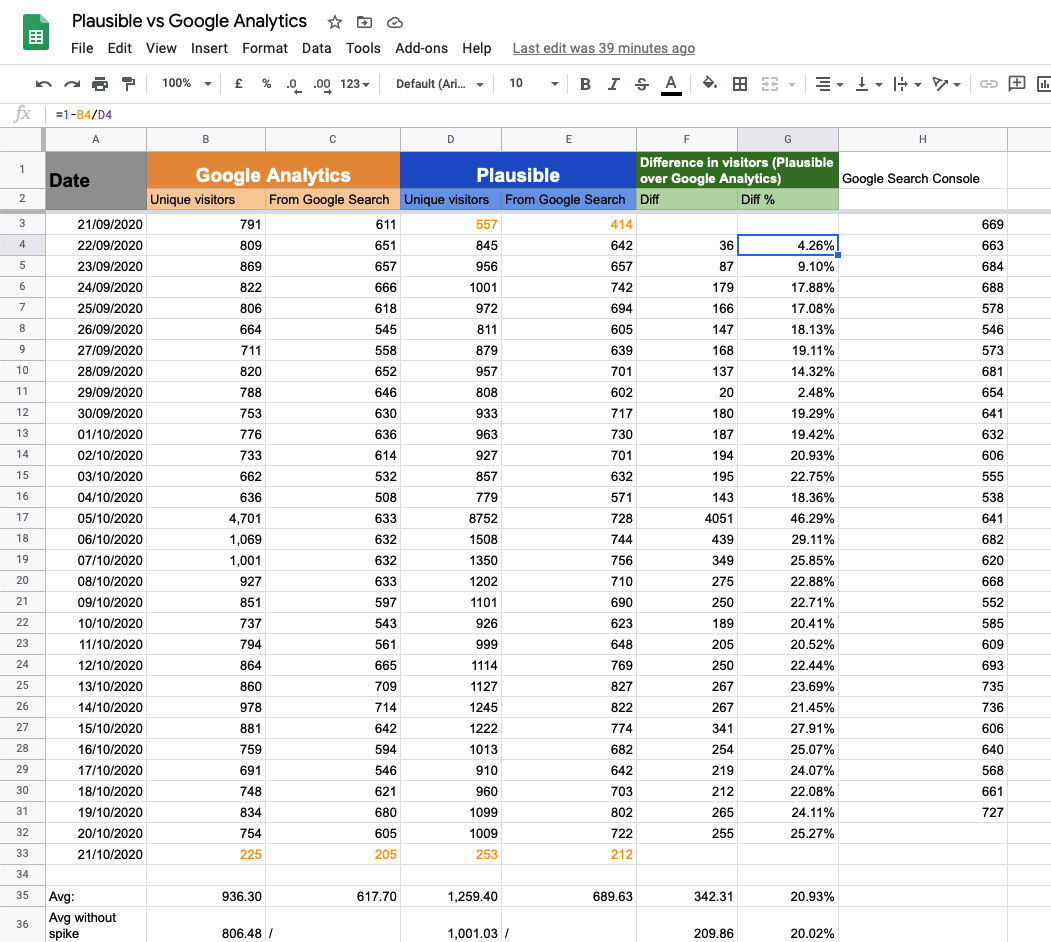
Let's start by comparing the number of visitors between Google Analytics and Plausible:
Straight away, you can see that Google Analytics is consistently reporting fewer visitors than Plausible. The following graph shows how many more visitors Plausible has recorded in comparison to Google (%):
Note the spike around October 5th from when my site was featured on Hacker News. On that day, Plausible reported 46% more visitors than Google Analytics. I can only attribute this to the fact that tech-savvy people (the ones that read Hacker News) are more likely to have an ad blocker installed.
On September 29th, however, we see the opposite: the difference between the two platforms is only 2,48%. I'm not sure what could've caused this break of pattern. Both Google Analytics and Plausible reported no operational issues during that time. Weird!
Compared to Google Search Console
To get another point of reference, I decided to compare both platforms against Google Search Console.
My assumption here is that Google Search Console should have very accurate data on how many visitors its search engine directed towards my site.
I further assumed that if Google Analytics is reporting 20% fewer visitors, we should see that reflected here. In other words: it should miss 20% of search traffic.
The results, however, are a bit weird:
Interestingly enough, Google Analytics is very close to the Search Console. It's not off by 20% like with other visits, and yet it's not reporting the same number either. It's missing 518 visitors, which could be explained by visitors who don't have Javascript enabled (which would still have been tracked by Search Console) or visitors that left my site before the analytics script was loaded.
Plausible, however, was reporting 6% more users coming from Google than Google Search Console itself. This left me puzzled. Is Plausible's metric incorrect? Or are they perhaps including traffic coming from search engines that are based on Google? Like for instance, Startpage.
Browsers
At this point, I wanted to see what other inconsistencies I could spot between both platforms, so I compared browser market share as well. I hoped to see if certain browsers would be harder on these analytics scripts than others.
Browser market share according to Google Analytics
Browser market share according to Plausible
In terms of browser market share, both platforms agree: Google Chrome is the most popular, followed by Safari and Firefox.
I did, however, spot some weird things as well:
- Google Analytics is reporting half as many Firefox users as Plausible Analytics (4653 vs. 2350). This might be due to Firefox's Enhanced Tracking Protection?
- Plausible only detected 249 Microsoft Edge users, while Google found 941 users. Almost 4 times as many. This might be an issue with Plausible's way of detecting Edge's user-agent (maybe recognized as Chrome now?)
- Internet Explorer has virtually no usage amongst my audience. Plausible reported no IE users, and Google Analytics reported only 3 (IE 11)
Amount of visits per browser. Browsers with low market share not included for clarity.
Operating systems
After comparing browser market share, why not compare OS market share as well. In all cases, Plausible reported more visits compared to Google Analytics.
Here, both platforms agree: Windows is most popular, followed by Android, iOS, macOS, and then Linux.
The following graph shows how wide the gap is between Plausible and Google Analytics (the percentage that Plausible has over Google Analytics):
Plausible reports more visits compared to Google Analytics across all platforms.
However, notice how much lower the gap is on mobile platforms. This could be explained by the fact that ad blockers aren't as common on mobile devices as on regular computers (they're not as powerful either, especially on iOS).
Also: Linux users seem to cause the most significant gap. This points towards a higher adoption rate of ad blockers amongst Linux users.
Some other, unrelated findings:
- ChromeOS accounted for only 0,25% of visitors, indicating that it's not a very popular platform amongst my audience.
- The analytics also uncovered some long-lost, ancient technologies: Plausible reported 4 Windows Phone users, and Google Analytics even found 3 people using a BlackBerry. There are so many questions I want to ask these 7 people.
Alternative explanation
At this point, it's clear that there is a discrepancy between Google Analytics and my self-hosted Plausible script.
However, it would be unfair to attribute this entirely to the use of ad blockers. The mismatch between both platforms could also have been caused by counting visitors differently or different strategies for filtering fake visits from bots.
Also: Plausible does not track people across their devices, while Google Analytics does. So if a user visits my webpage on his phone and laptop, Plausible will count 2 unique users, while Google Analytics would only count 1.
This could partly explain the discrepancy, but it cannot account for 20%. My website's bounce rate (people that only visit a single page and never return) is relatively high on both platforms. I rarely see people returning to my site, let alone from another device.
Aligned with ad block estimates
That being said, the discrepancy between both platforms (~20%) is in line with the estimated adblocker usage by internet users.
So, in short: I do believe that ad blockers have an impact on web analytics, and depending on your target audience, that could be significant.
Next steps
So what is the next step for this site? Well, at the time of writing, I'm not moving away from Google Analytics just yet. While Plausible offers an excellent service, I believe that the cost of $96 is a bit too high for a small blog like this one - especially one without revenue.
That being said, I'm aware of the privacy issues that Google Analytics poses, and I'm actively looking at more alternatives. That includes: self-hosting Plausible or Fathom Analytics or using server-side analytics like GoAccess. Or heck, maybe I'll roll my own based on the Beacon API.
Conclusion
Ad blockers seem to have a significant impact on Google Analytics and possibly many other analytics tools. In the case of this website (target audience: tech-enthusiasts), Google Analytics is underreporting the number of visitors by 20% on average compared to an analytics service that isn't blocked.
Raw data
All of the raw data is available so that you can analyze it yourself. That includes the total amount of visits per day, browser market share, and OS market share.
- Google Sheet: https://docs.google.com/spreadsheets/d/1VOizTtfeQ2w3KXdj0h5njy4K88fKWISfTLVrvJ8Xryk/edit?usp=sharing
- Exported as Excel file: Download here

Special thanks to Plausible Analytics. They did not sponsor this blog post, but I do appreciate the service they run! It was super easy to set up, and they allow you to download all collected data in CSV format.
