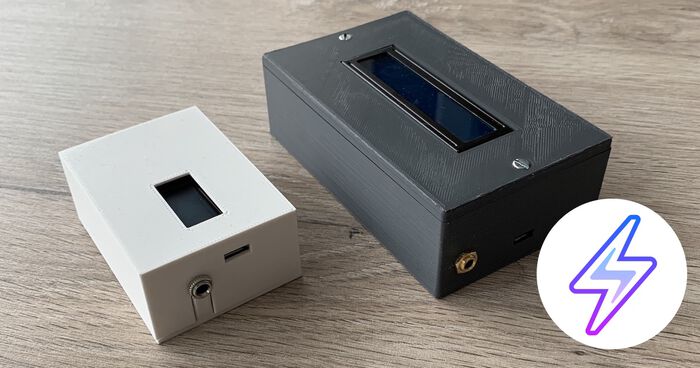
DIY Home Energy Monitor: ESP32 + CT Sensors + Emonlib
One day I was wondering: how much electricity is flowing through my apartment right now? Looking online I found various sensor devices like Smappee and Sense, but those are relatively expensive and even require a subscription. So I decided to build my own with an ESP32 and the SCT-013 sensor. My very own Fitbit for electricity consumption!
Since this post I've made an improved version. Read more about Home Energy Monitor V2 here.
Goal
Before jumping in, I set myself these goals for the project:
- Make a non-invasive energy monitor for the entire apartment. Meaning: no wire-cutting and not putting a meter between every socket and light bulb.
- Take measurements every second to get an accurate picture of electricity consumption.
- Save all the data in the cloud for later use & analytics.
- Have a simple app to visualize the data and analyze trends over time.
With those in mind, I started building my own home energy monitoring device!
The parts
I started by looking for parts on AliExpress. I’m no expert in electrical circuits so I followed this guide from OpenEnergyMonitor and ultimately landed on these parts:
| Item | Price |
|---|---|
| ESP32 | €3,98 |
| LCD Display (I2C) | €1,95 |
| Protoboards | €2,05 |
| Headphone jacks | €3,30 |
| Capacitors (10µF) | €0,66 |
| CT Sensor (YHDC SCT-013) | €10,99 |
| Resistors (between 10k and 470k Ω) | Already had them |
| Total | €22,93 |
The two most important components are obviously the ESP32 microcontroller and the CT sensor.
ESP32
The ESP32 is a no-brainer for me because I’ve used it before on small projects. They are small, are easy to program (Arduino compatible), have a lot of power (240MHz dual-core processor, 520K memory) and have built-in WiFi which means they can directly connect to the internet. No hubs needed.
CT Sensor
The other important part is the CT sensor (Current Transformer). This sensor clamps over the main cable in your house and transforms the magnetic field around the cable into a voltage.
I went for the YHDC SCT-013-030 which can measure up to 30 amps of current (almost 7000 watts). More than sufficient for my small apartment. This model will output a voltage between 0 and 1, which is easy to measure using the built-in ADC of the ESP32.
Others
I also ordered a small LCD display to show the electricity consumption in real-time on the device itself.
And finally, I ordered some 3,5mm headphone jacks. Why? Well the CT sensor has a 3,5mm connector. My initial thought was to cut it off and connect the wires straight to the ESP. But then I figured it would be nicer to use an actual 3,5mm jack. That way I could swap my sensor, should it be required.
Wiring
Once the components arrived I wired everything up like this:
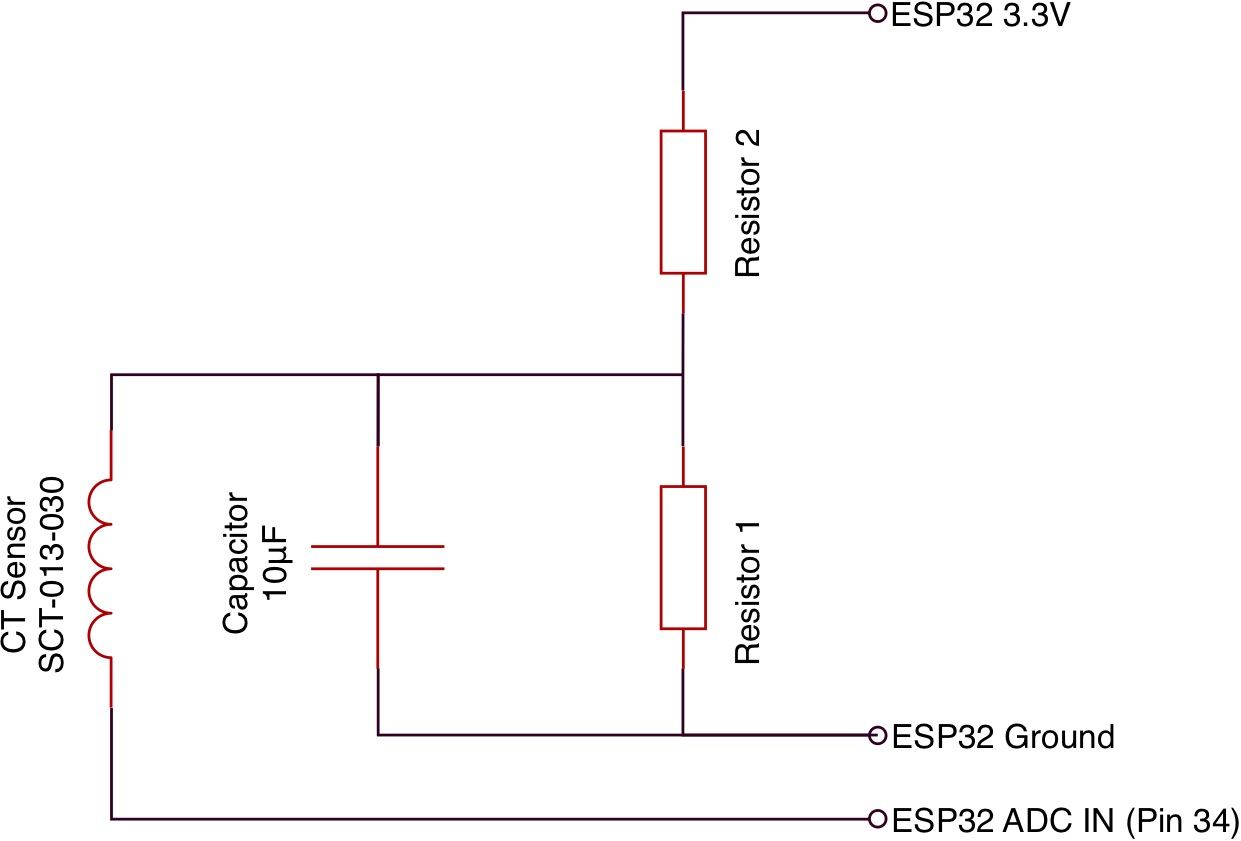
Note: I used 2x 100kΩ resistors, but you can use any resistor value between 10k and 470k. Just make sure R1 and R2 are of the same value.
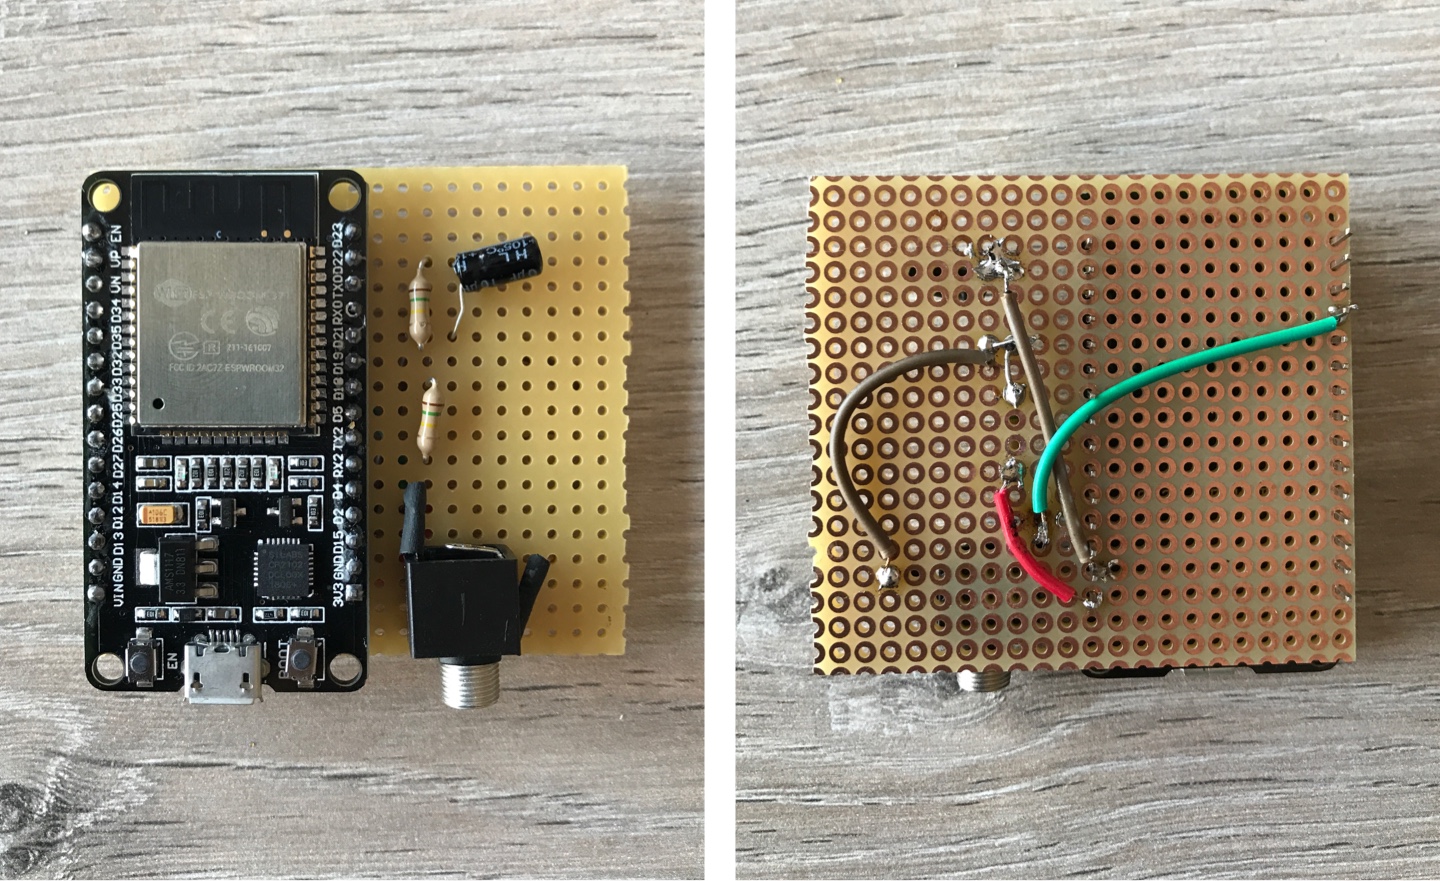
I first tried it on a breadboard to verify that everything worked and moved it to a protoboard afterward:
Designing a case in Fusion360
The protoboard doesn’t look very bad. But it’s not sexy either. So I fired up Fusion 360 with the intention of designing a case so that this could become a consumer product (spoiler alert: it won’t turn out like that).
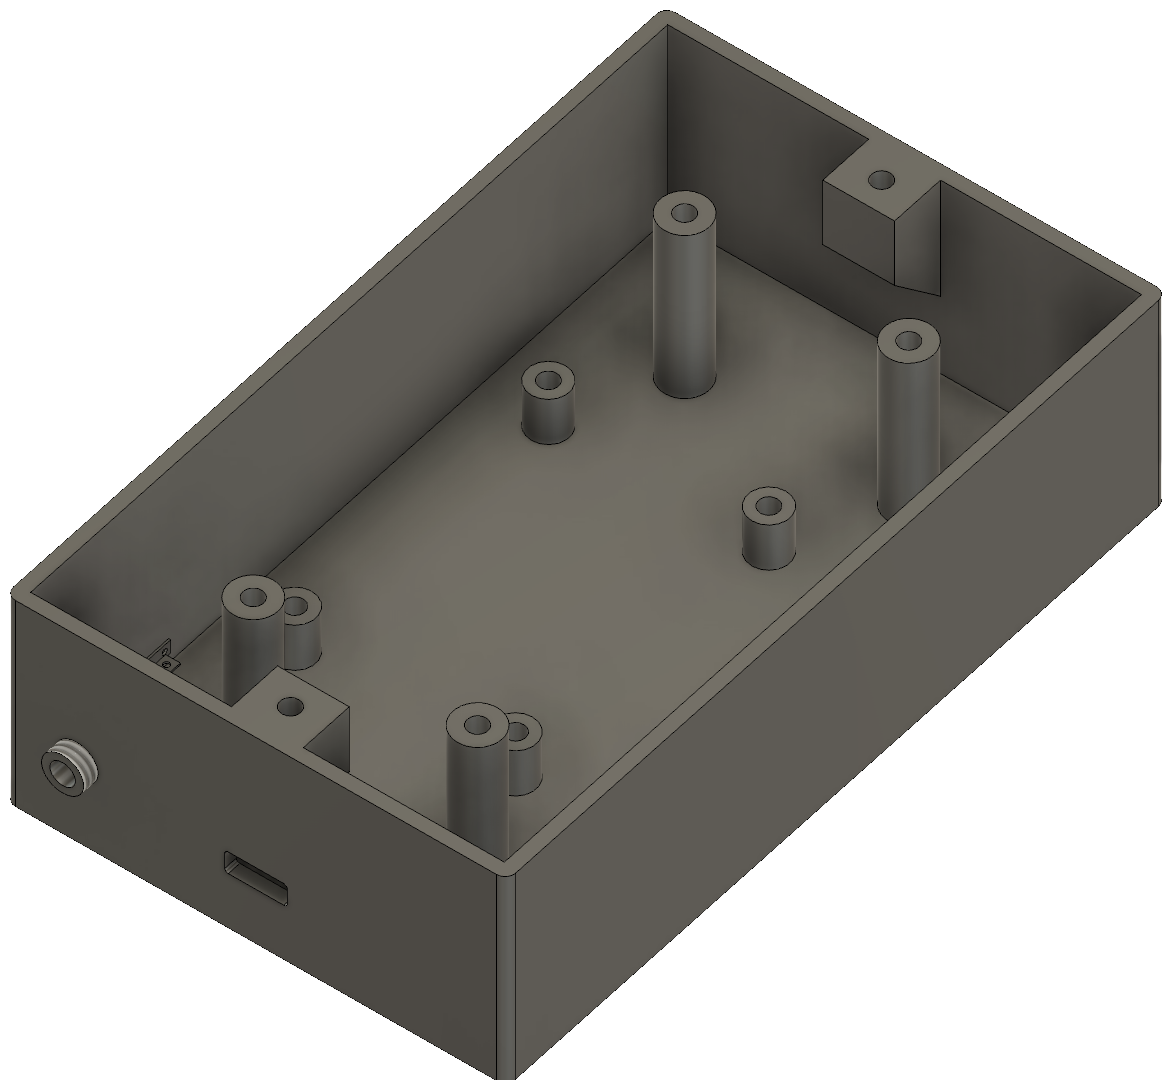
I started by designing a case that has two cutouts on the side. One for the micro USB connector (which is used to power everything) and one for the headphone jack (so that the CT sensor can be connected). I also added a number of standoffs in the middle to support the protoboard and the display.
This is what I ended up with:
And this is how the display mounts on top of the standoffs:
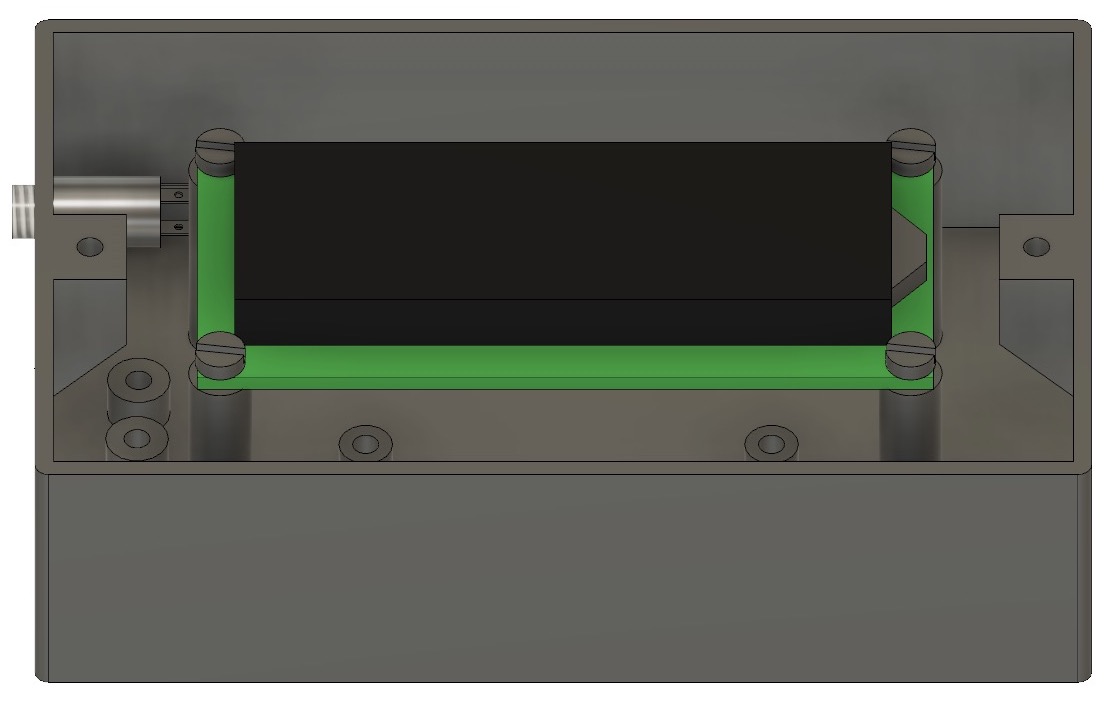
In case you’re wondering: yes, I made dummy models of the display and screws. I like to see how everything fits together before sending it off to the 3D printer.
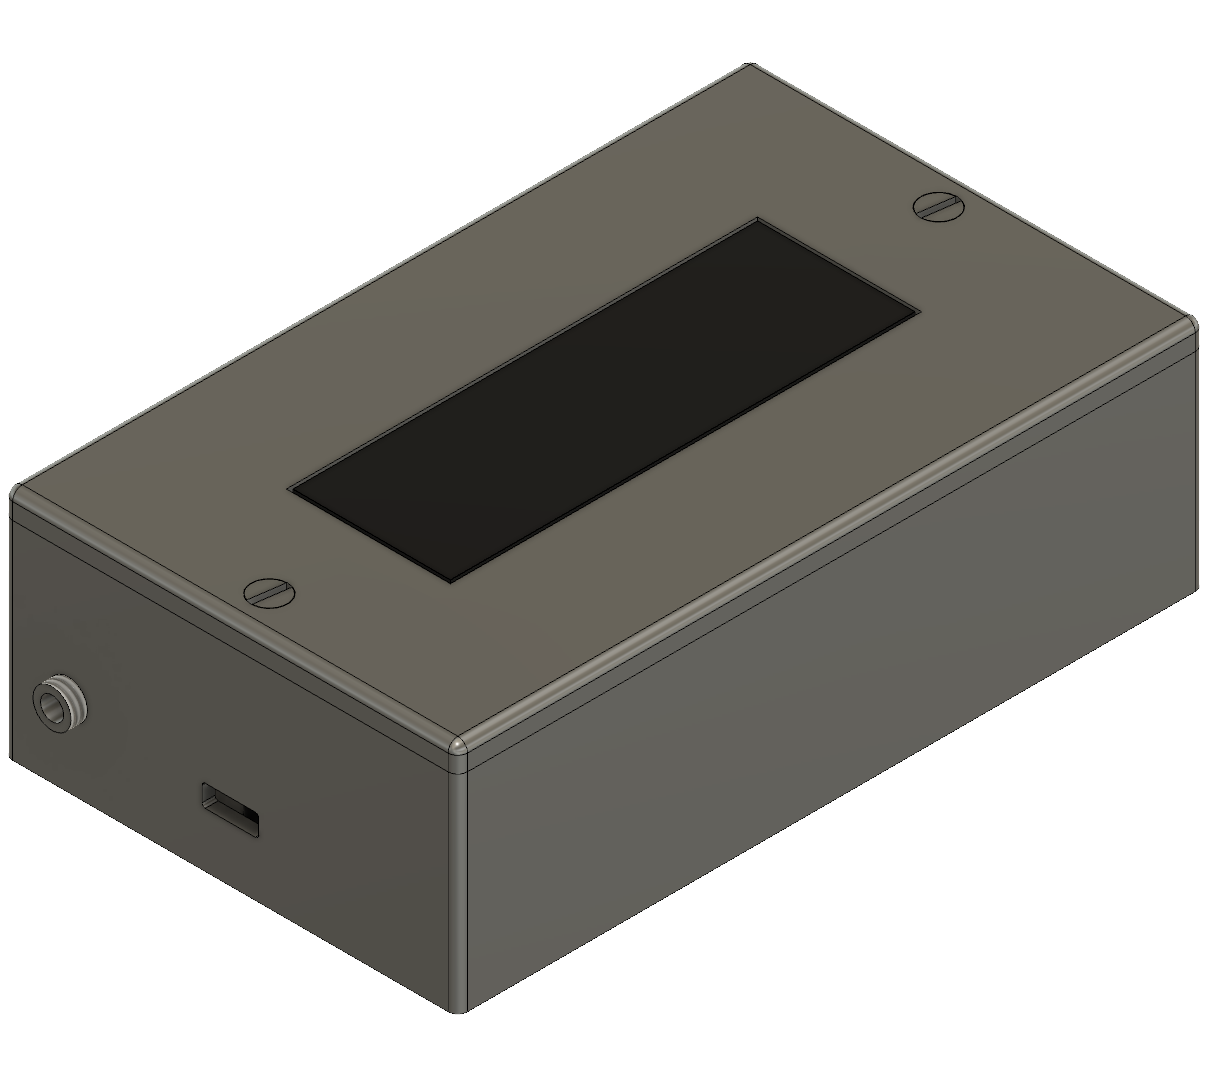
To finish the case, I designed a top lid that is held in place with two screws and has a cutout for the display. Oh and the display sits flush with the top of the lid. Sweet!
Ingesting data (with AWS)
After that, it was time to think about how I wanted to get the readings into a system where I could analyze them.
The people at OpenEnergyMonitor have an open source system called EmonCMS. It’s specifically designed to ingest data from energy monitors. It either runs on a Raspberry Pi that you host yourself or you can use their cloud service. Hosting my own Pi is out of the question. I’m not interested in having to manage it, taking backups and overcoming problems with corrupted SD cards. With their cloud service, you don’t have to do anything yourself and it only costs £1 per year per data feed. However, you can only post data once every 10 seconds and I wanted to store one data point per second.
So I decided to make it a fun exercise and build myself a backend that can ingest this data. I’m quite an avid user of AWS and I have experience with their IoT service, Lambda, and DynamoDB. So going for AWS was a no-brainer!
Before designing the architecture I set out some goals (again):
- It has to be Serverless. I don’t want to manage servers.
- No fixed costs (pay for what you use).
- It must be able to handle multiple sensors (you never know what the future brings)
- Must be able to handle any data rate (ideally 1 reading every second)
- Never throw away data! Always archive it and keep it for the future. You never know what might be interesting.
This is the architecture that I came up with:
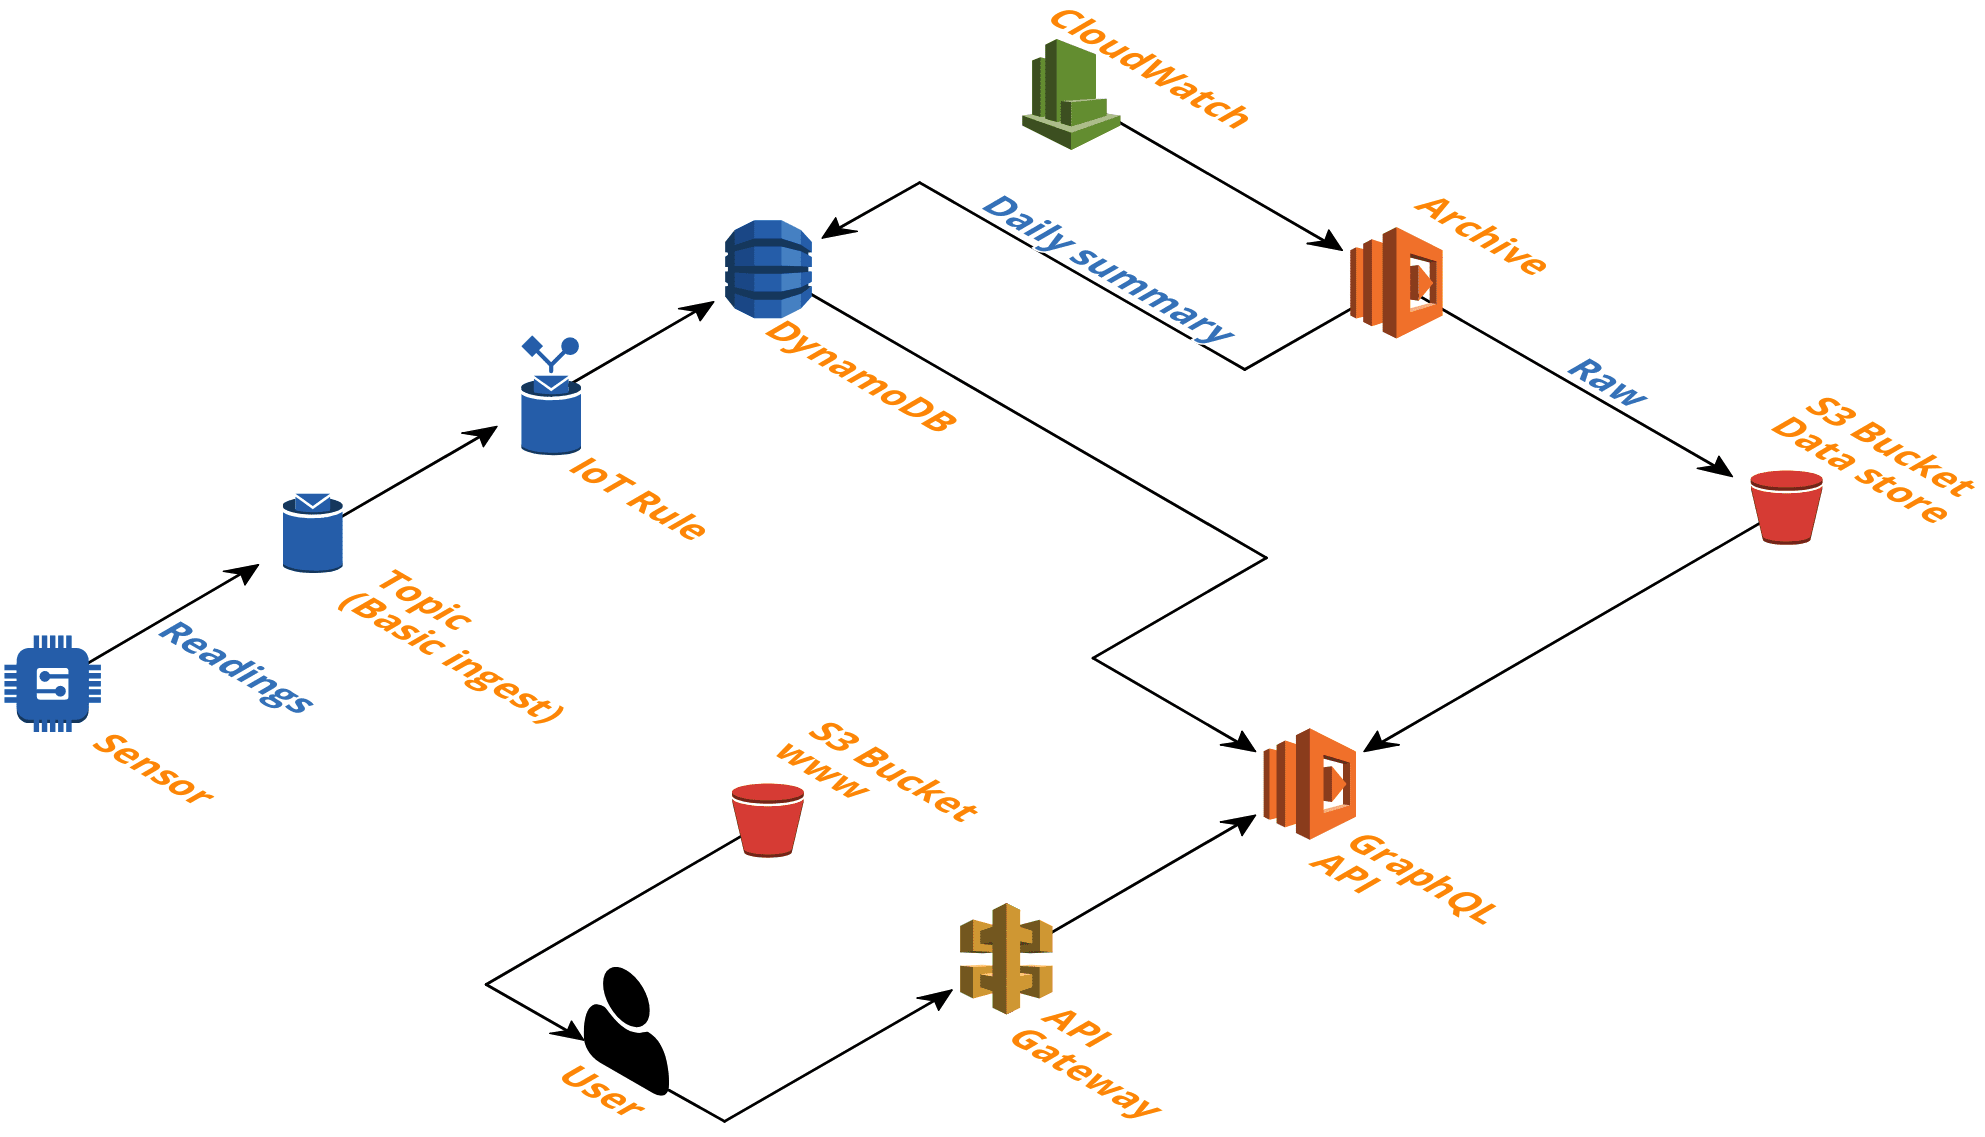
Let me explain: on the left side you see the monitoring device. Every 30 seconds it sends 30 readings over an MQTT connection to the AWS IoT service. Once the message is received, an IoT Rule is triggered that writes the raw reading to a DynamoDB table. This happens 2880 times a day (2 times per minute, 1440 minutes in a day).
Small side note: by default AWS uses a message broker that dispatches messages coming from your devices to one or more “listeners” (eg a Lambda function). In this case, however, there aren’t multiple consumers. Data should go straight into Dynamo. So I can get away with using the Basic Ingest feature of AWS IoT (which is 25% cheaper).
Archiving data
Storing raw data in DynamoDB is great to be able to query the latest readings or to show an overview of the current day. It is, however, not the best long-term solution. The sensor is generating 2880 data points every single day. That means that if I want to get an overview of how much electricity was consumed last month, I need DynamoDB to return at least 30*2880 or 86.400 data points. This would consume a lot of read capacity units (RCU).
Instead, I realized that older data doesn’t have to stay stored in DynamoDB. I could offload old data and store it on S3 instead! So, I made a Lambda function that is triggered at night and archives all readings from the past day to a single CSV file on S3:
Timestamp,Watts
1561939171,115
1561939172,133
1561939173,132
1561939174,137
1561939175,145
1561939176,141
1561939177,132
...
(Uncompressed these files are 1.2MB in size, gzip compression reduces that to 280KB. Storing a year worth of data required at most 438MB or about 100MB compressed)
This not only reduces my storage costs, but it also makes retrieving older data much more efficient. Getting all the readings from a particular day in the past is as simple as fetching 1 file from S3.
After setting up this Lambda function, I enabled DynamoDB’s TTL feature so that raw readings are automatically removed from the table after 7 days.
Calculating total consumption
This nightly Lambda function also calculates the total amount of electricity (kWh) that was used during the previous day. This metric can then be used to visualize daily consumption over time.
This calculated value is stored in DynamoDB so it can be quickly retrieved and doesn’t have to be recalculated ever again.
This is a summary of what happens at the end of each day:
DynamoDB: Raw readings, stored for 7 days
 | -> Archived to S3 every night
 | -> Total consumption written to DynamoDB (1 row)
Costs
The cost of all of this is exactly: $0. This entire architecture falls under the AWS free tier (until I have more than 5GB of archived data in S3 or more than 25GB stored in DynamoDB)
Arduino software
The cloud architecture is ready and waiting for sensor data! I now started working on the software to run on the ESP32. I decided to use the Arduino framework because the documentation is great and they have a bunch of libraries ready to go (also because using the Espressif SDK was a bit intimidating).
Let’s break the code down into multiple sections. I started by importing all the libraries that I need and defining some configuration variables:
#include <Arduino.h>
#include <LiquidCrystal_I2C.h>
#include "EmonLib.h"
#include "WiFi.h"
#include <driver/adc.h>
#include "config/config.h"
#include "classes/AWSConnector.cpp"

// This is the device name as defined on AWS IOT
#define DEVICE_NAME "xd-home-energy-monitor-1"

// The GPIO pin were the CT sensor is connected to (should be an ADC input)
#define ADC_INPUT 34

// The voltage in our apartment. Usually this is 230V for Europe, 110V for US.
// Ours is higher because the building has its own high voltage cabin.
#define HOME_VOLTAGE 247.0

// Define some variables to establish an MQTT connection with AWS IOT
#define AWS_IOT_ENDPOINT "xxxxxxxxxxx.iot.eu-west-1.amazonaws.com"
#define AWS_IOT_TOPIC "$aws/rules/xxxxxxxxxxx"
#define AWS_RECONNECT_DELAY 200
#define AWS_MAX_RECONNECT_TRIES 50

// Force EmonLib to use 10bit ADC resolution
#define ADC_BITS    10
#define ADC_COUNTS  (1<<ADC_BITS)

// Create instances
AWSConnector awsConnector;
EnergyMonitor emon1;

// Wifi credentials
const char *WIFI_SSID = "YOUR WIFI NETWORK NAME";
const char *WIFI_PASSWORD = "WIFI PASSWORD";

// Create instance for LCD display on address 0x27
// (16 characters, 2 lines)
LiquidCrystal_I2C lcd(0x27, 16, 2);

// Array to store 30 readings (and then transmit in one-go to AWS)
short measurements[30];
short measureIndex = 0;
unsigned long lastMeasurement = 0;
unsigned long timeFinishedSetup = 0;
Then I wrote two helper functions to write the current energy consumption and the IP address to the LCD display. That way I can re-use them in other parts of the code:
void writeEnergyToDisplay(double watts, double amps){
  lcd.setCursor(3, 1); // Start from column 3, first two are broken :/

  lcd.print((int)watts);
  lcd.print("W ");
  lcd.print(amps);
  lcd.print("A    ");
}

void printIPAddress(){
  lcd.setCursor(3,0);
  lcd.print(WiFi.localIP());
}
I want the ESP to continuously send readings to the cloud, so we’re going to need a WiFi connection. Again, I created a helper function for this. While trying to connect it will show WiFi... on the display. I also configured the ESP to use a custom hostname so I can quickly identify it on the network:
void connectToWiFi() {
  lcd.clear();
  lcd.setCursor(3, 0);
  lcd.print("WiFi...      ");

  WiFi.mode(WIFI_STA);
  WiFi.setHostname("esp32-energy-monitor");
  WiFi.begin(WIFI_SSID, WIFI_PASSWORD);

  // Only try 15 times to connect to the WiFi
  int retries = 0;
  while (WiFi.status() != WL_CONNECTED && retries < 15){
    delay(500);
    Serial.print(".");
    retries++;
  }

	// If we still couldn't connect to the WiFi, go to deep sleep for a
  // minute and try again.
	if(WiFi.status() != WL_CONNECTED){
  		esp_sleep_enable_timer_wakeup(1 * 60L * 1000000L);
		esp_deep_sleep_start();
	}

  // If we get here, print the IP address on the LCD
  printIPAddress();
}
Now it’s time for the setup() function. Here we initialize the ADC so that it listens to the signal coming from the CT sensor, initialize the display, connect to the WiFi, initialize the emonlib library and print AWS connect to the display:
void setup()
{
  adc1_config_channel_atten(ADC1_CHANNEL_6, ADC_ATTEN_DB_11);
  analogReadResolution(10);
  Serial.begin(115200);

  lcd.init();
  lcd.backlight();

  connectToWiFi();

  // Initialize emon library (30 = calibration number)
  emon1.current(ADC_INPUT, 30);

  lcd.setCursor(3, 0);
  lcd.print("AWS connect   ");
  awsConnector.setup();

  timeFinishedSetup = millis();
}
Quick sidenote on emonlib: the CT sensor will produce a sin wave because it’s clamped to a wire carrying AC current. Emonlib is a library that will convert these raw, sinus wave readings into amps.
And finally, the loop() function. This one is a bit more complex than your regular Arduino starter project. I only want to take a measurement once every second. Traditionally that would mean putting a delay(1000) at the end of our loop function. However, in my case, that would make the MQTT connection with AWS unstable.
Instead, I keep track of when the last measurement was taken. If that was over 1000 milliseconds ago I take a new one. That way the loop function can go as fast as it wants and the MQTT connection stays stable:
void loop(){
  unsigned long currentMillis = millis();

  // If it's been longer then 1000ms since we took a measurement, take one now!
  if(currentMillis - lastMeasurement > 1000){
    double amps = emon1.calcIrms(1480); // Calculate Irms only
    double watt = amps * HOME_VOLTAGE;

    // Update the display
    writeEnergyToDisplay(watt, amps);

    lastMeasurement = millis();

    // Readings are unstable the first 5 seconds when the device powers on
	  // so ignore them until they stabilise.
    if(millis() - timeFinishedSetup < 10000){
      lcd.setCursor(3, 0);
      lcd.print("Startup mode   ");
    }else{
      printIPAddress();
      measurements[measureIndex] = watt;
      measureIndex++;
    }
  }

  // When we have 30 measurements, send them to AWS!
  if (measureIndex == 30) {
    lcd.setCursor(3,0);
    lcd.print("AWS upload..   ");

    // Construct the JSON to send to AWS
    String msg = "{\"readings\": [";

    for (short i = 0; i <= 28; i++){
      msg += measurements[i];
      msg += ",";
    }

    msg += measurements[29];
    msg += "]}";

    awsConnector.sendMessage(msg);
    measureIndex = 0;
  }

  // This keeps the MQTT connection stable
  awsConnector.loop();
}
Installing the sensor
With the ESP programmed it was time to install the sensor! I opened my electrical box, looked for the biggest brown wire I could find (the main supply) and clamped the CT sensor over it.
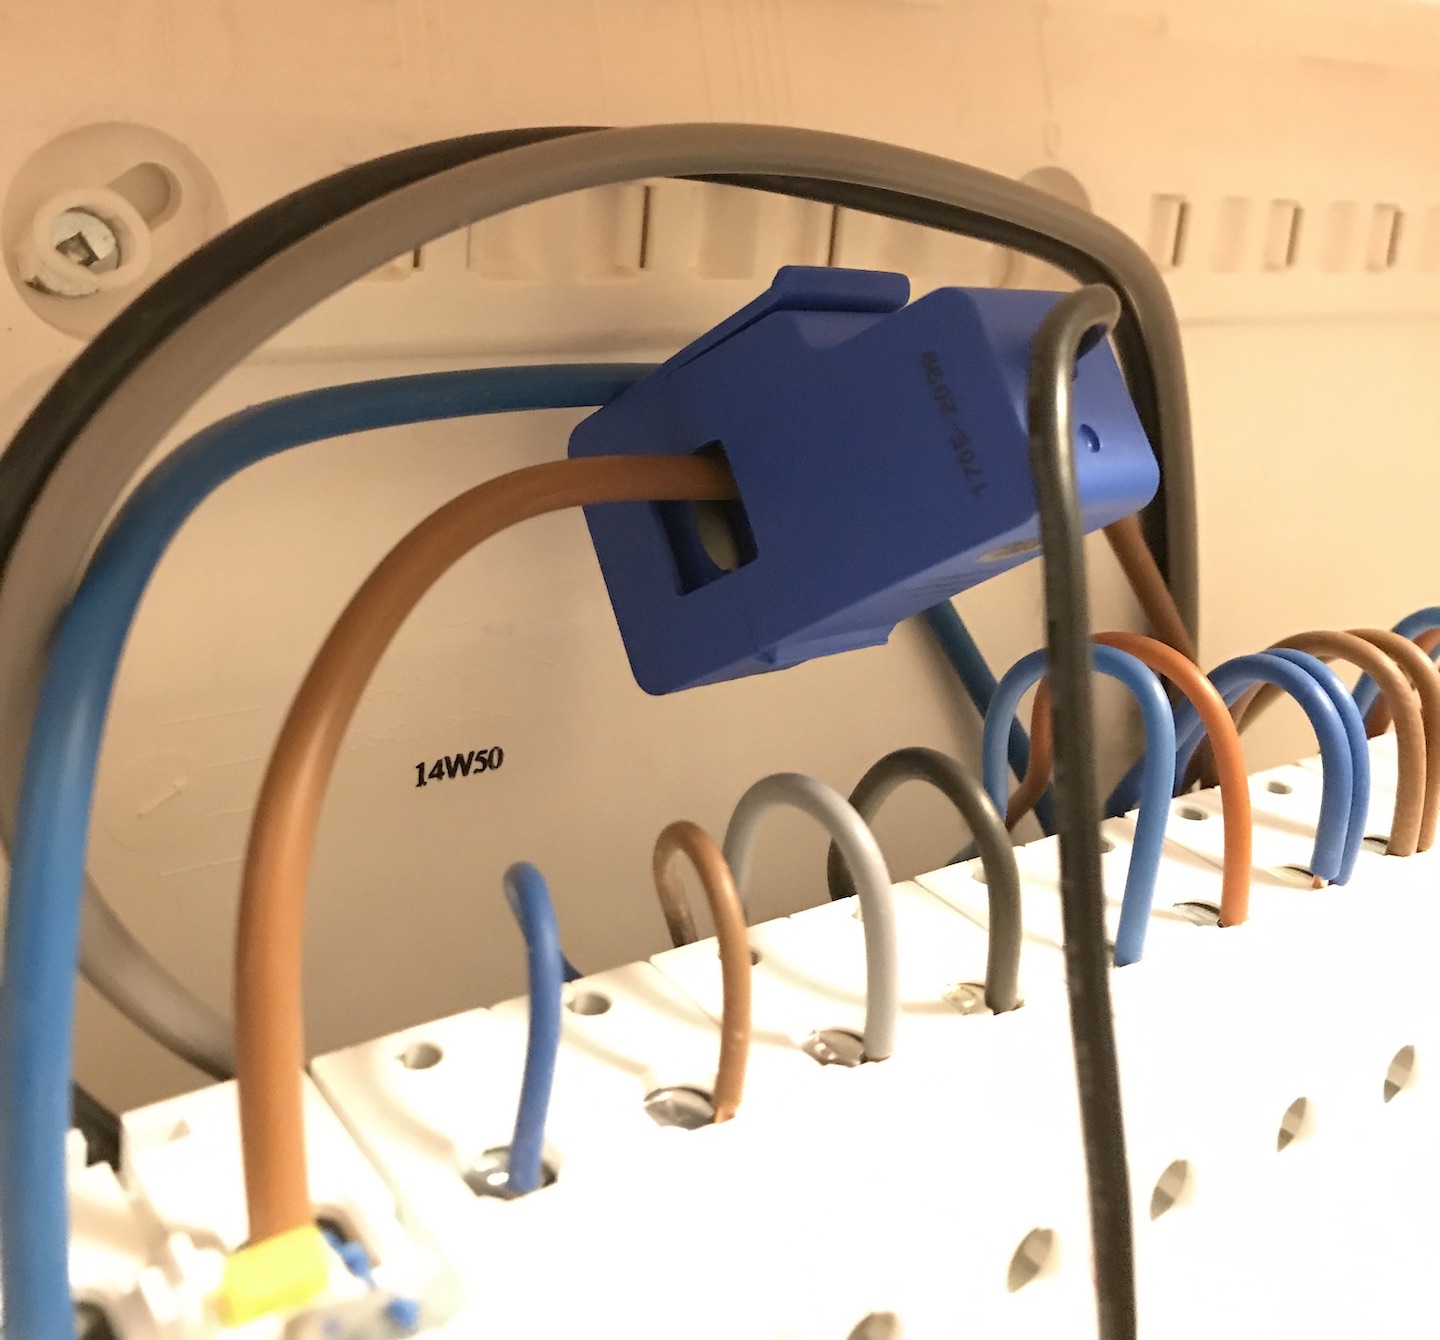
Then I routed the cable safely outside and connected it to the microcontroller.
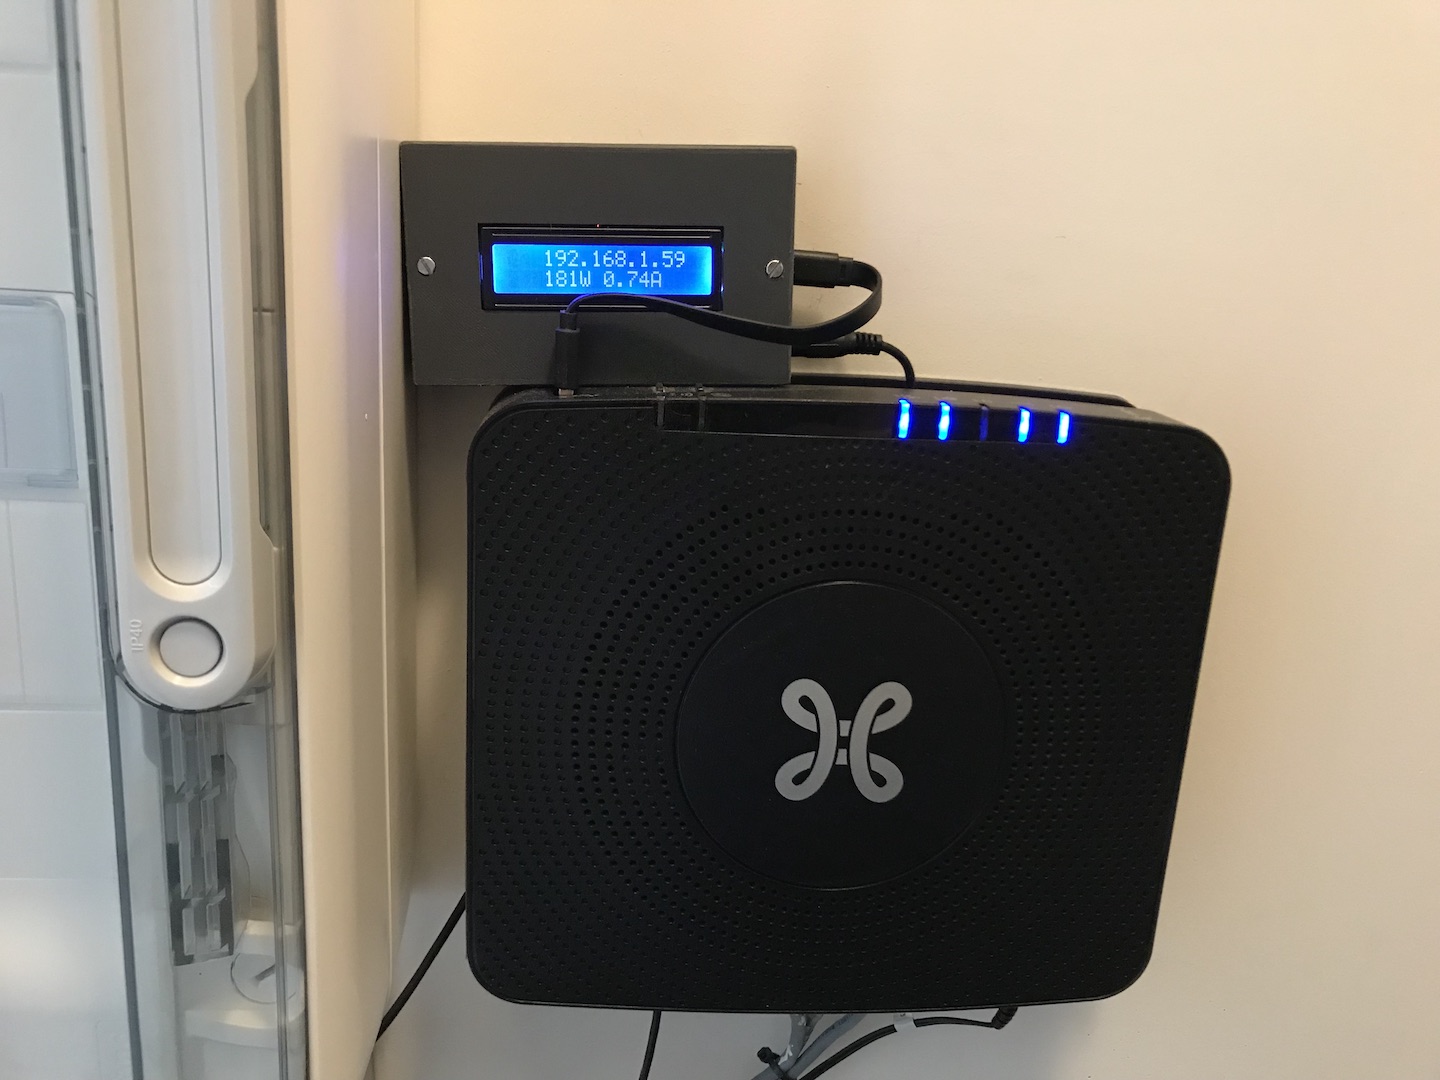
I then waited a few minutes, checked AWS and saw the data flowing into DynamoDB. Success!
Exposing data with GraphQL
With the data flowing into DynamoDB, I needed a way to access it. So I wrote a GraphQL API that runs on Lambda and lets me query the latest readings or readings between a given time range.
I then wrote a simple web application (hosted in an S3 bucket) that visualizes the readings with Dygraphs. This was mainly for testing purposes until I had time to create an app.
One shortcoming: right now my GraphQL API only reads data from DynamoDB. That means that data older than 7 days aren’t accessible via the API anymore. So I have to adapt the API so that it reads real-time data from Dynamo and historical data from S3.
Ionic app
Now that I had a GraphQL API, I wanted to create a simple app so I could check the readings on my phone. So, I broke out Ionic framework, interfaced with the same GraphQL API and this is what the app looks like:
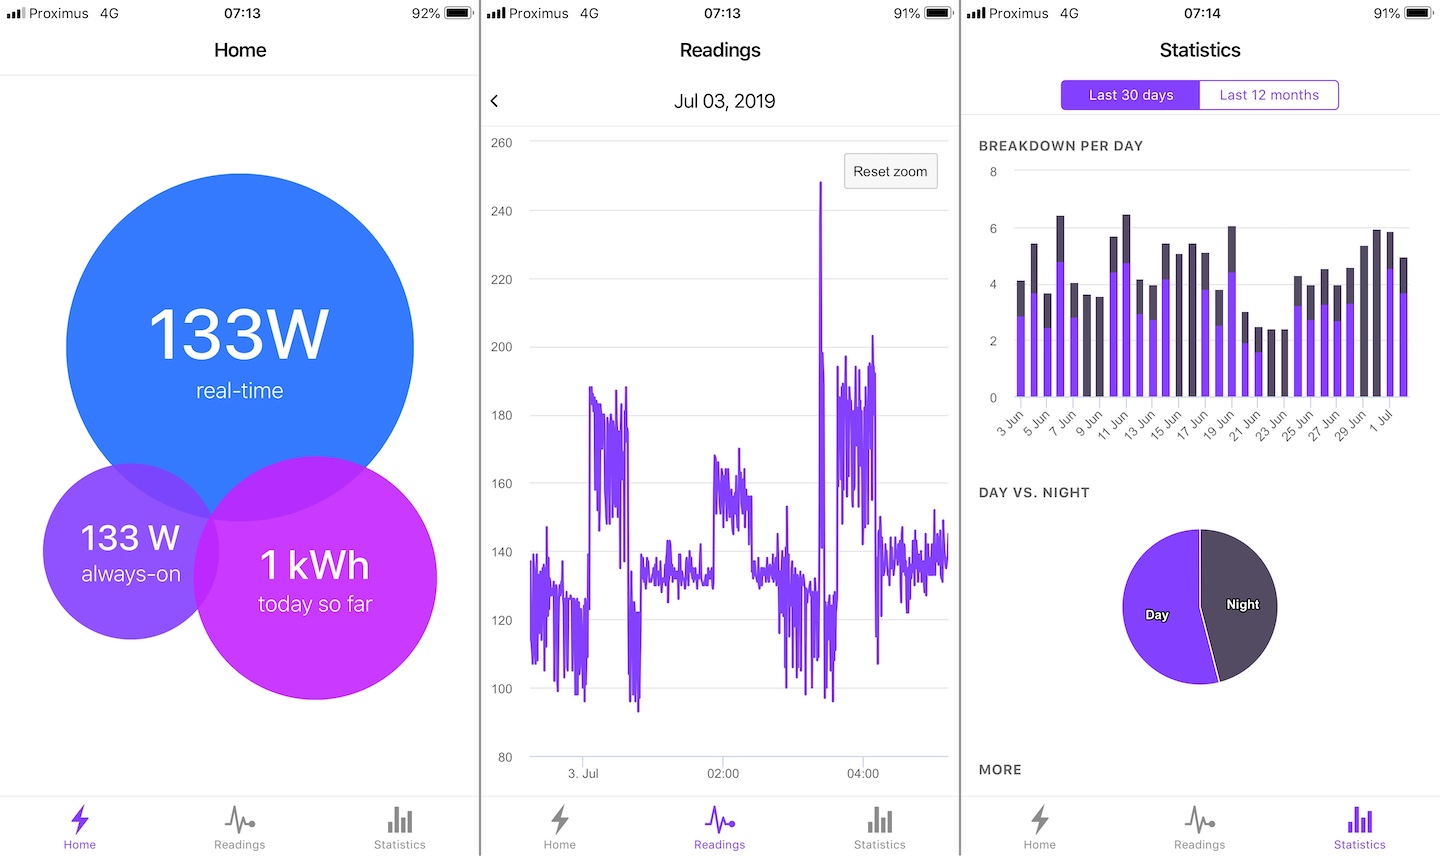
The homepage shows the current situation in a nutshell: how much electricity is being consumed right now, how much has been used today (so far) in total and the amount of “standby” power.
The second tab shows the raw readings for the last 24 hours and the last tab shows our electricity consumption of the last 30 days. We’re currently consuming between 4 and 6kWh of electricity. It also breaks down how much electricity was consumed on day/night tariff.
What readings look like
After a couple of days of having the setup running, I started to see patterns in the data. Each appliance in the apartment generates a specific “signature” of electricity consumption. Here are just a few examples.
This is our fridge (or freezer) periodically turning on the compressor (?):

This is how our oven consumes energy. It initially uses 2000W for a couple of minutes to preheat. Then, once it gets up to temperature, starts to turn itself on/off to keep the temperature inside.

Future improvements
Before wrapping up, I want to talk about future improvements. This project is not completely finished and over time I would like to:
- Automatically recognize appliances based on their consumption pattern.
- Tweak the GraphQL API so it can read historical data from S3.
- Investigate if I could put the ESP32 inside the electrical box on a DIN rail
- Integrate with Google Home (if they provide device traits for energy monitors ;) )
Conclusion
That’s a wrap! My home energy monitor has been running since January 2019 and it’s still going strong.
Buying an existing sensor is certainly possible but I had way too much fun building one myself. I also learned a lot about electronics, ESP32 programming, and how to set up AWS for IoT purposes.
What do you think about this project? Would you like to see more DIY projects? Let me know!
Also check out the improved Home Energy Monitor V2.
Downloads
- Fusion360 files for the case + top lid
- Full Source Code (ESP32 + AWS + App) available on GitHub


